Background & Theory
“Corrosion Djinn”, has been developed by Corrdesa LLC under SBIR funding from the Office of Naval Research. Corrosion Djinn is software designed to calculate the corrosion current across an interface between two galvanically different materials, from which we can estimate the corrosion rate of the more anodic (less noble) material.
Galvanic Corrosion
Galvanic corrosion is an electrochemical process in which an oxidation-reduction reaction occurs. The anode is the electrode where the oxidation half of the oxidation-reduction reaction takes place. Similarly, the reduction half of the reaction takes place at the cathode. In principle, galvanic corrosion is characterized by localization of the anodic and cathodic processes in different regions. These different regions can be found on the same metal surface between different microscopic phases, as well as between two dissimilar materials electrically in contact with each other in the presence of conductive electrolyte. The direction of the electrochemical process between two dissimilar metals or phases depends on the difference between the two Gibbs free energies, \({\Delta}G\) 2.
The tendency for a bimetallic couple to corrode can be expressed in terms of thermodynamic parameter, the electromotive force \({\text{(EMF)}}\) or the static corrosion potential of the corrosion cell 3. The polarity and direction of galvanic current flow between two connected bare materials is determined by the thermodynamic reversible potentials of the materials. The material which has a higher reversible potential in the electromotive force \({\text{(EMF)}}\) series or galvanic series is the cathode in the galvanic couple. The relation between \({\Delta}G\) and \({\text{EMF}}\) is defined by:
where
- \(n\) = Number of electrons taking place in the reaction
- \({\Delta}E = {\text{EMF}}\) (difference between the EMFs of the two members of the ion couple)
- \(F\) = Faraday’s constant
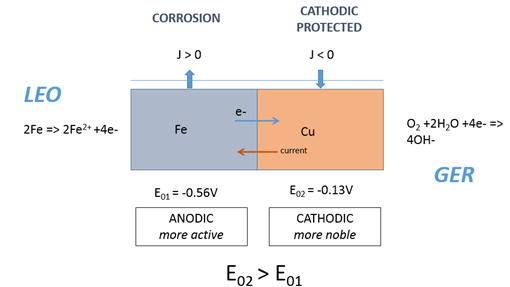
The principal phases in the operation of a galvanic corrosion cell are illustrated in Figure 1 in chloride ions containing electrolyte. When galvanic corrosion takes place, the less noble metal acts as the anode and is oxidized according to:
The cathodic process in galvanic corrosion in near-neutral electrolyte is often stated in terms of the oxygen reduction reaction 4
Equations (4) and (5) represent corrosion processes taking place in the acidic environments encountered in industrial processes or for the confined volumes (pits, crevices) where the pH can reach acidic values because of hydrolysis reactions.
In a galvanic system, current flow between anode and cathode either on a single material or between two different materials will take place by the movement of electrons from anodic to cathodic regions and in the solution by movement of cations from the anodic to the cathodic regions and movement of anions in the opposite direction. In Figure 1, we consider the case of an iron-copper galvanic couple in an aqueous solution. The dissolution (oxidation) of the iron results in a loss of electrons which travel through the metallic members (current in the opposite direction by definition), ie LEO, acronym for Lose Electron = Oxidation. The ferrous ions are then mobile in the electrolyte layer. Meanwhile, on the copper side of the couple, the excess of electrons on the copper surface combine with the water and oxygen (reduction) in the aqueous solution resulting in hydroxyl ions, ie, GER, as an acronym for, Gain Electron = Reduction.
The material effect of galvanic corrosion will therefore appear principally on the anodes. On the cathodically acting areas there will be no appreciable loss of metal. Galvanic corrosion can occur on the macroscopic level or/and on the microscopic level. On the macroscopic level, dissimilar materials comprise of at least one anode and one cathode. On the microscopic level, inhomogeneity within a single material due to alloying elements, causes different microstructural features to act as local anode and cathode.
From Ohm’s Law, we learn that potential is the product of current and resistance. From this perspective we can consider the electrical circuit to comprise a number of potential drops, or iR drops. In the metals the iR drop will be very low, since metals have a very high conductivity (equivalent to reciprocal of resistivity). Whereas, the iR drop in the electrolyte depends on the combining effect of the physical electrical conductivity of the solution along with the resistance experienced at the metallic/electrolyte interface due to the reactions and varying mobilities of the ions. This latter effect is captured and referred to as polarization effects and can be measured with respect to a reference potential. Consequently, if we know the polarization curves for the materials under consideration, for that particular environment, then we can quantify the galvanic current and hence the galvanic corrosion.
Even though MIL-STD-889C, like many other similar standards and proprietary guidelines, suggests that the magnitude of the difference in galvanic potential between two dissimilar materials is an indication of corrosion risk, the standard does recognize that this is an over-simplification, as we expand upon in the next section.
Polarization Curve
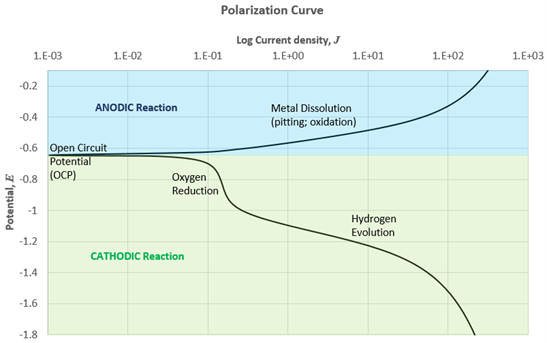
The combined experimental measurement of potential and current relationships \(({E} \space {\text{vs}} \log(I))\) for an operating corrosion cell over a wide range of oxidizing conditions results in polarization curves that describe the complete electrochemical behavior of a material, see Figure 2. The curve on the blue and the green region represents the involved anodic and cathodic reactions of the material respectively. In a polarization curve, the current represents the rate with which the anodic or cathodic reactions are taking place on a material surface. Typically, the current is expressed in terms of the current per unit area of the exposed surface, or the current density. The electrochemical interactions between two dissimilar materials typically involve metal pitting and dissolution, oxidation, and hydrogen evolution reactions, all of which must remain in balance so that the anodic currents on the anode equal the cathodic currents on the cathode 5. Many variables will influence the rate of a given electrochemical reaction, including the temperature, the surface condition of the surface being interrogated, as well as the chemical environment in which the experiment is performed.
Given sufficient quantitative information from the polarization curve about the electrochemical processes occurring on a material, mixed potential theory can be used to predict a corrosion rate.
Mixed potential and polarization curve-crossing
Corrosion Djinn is based on the well established fundamental electrochemical principle of mixed potentials, first elucidated by Wagner and Traud 6 in 1938 based on two simple hypotheses. First, any electrochemical reaction can be divided into two or more oxidation or reduction reactions, and secondly, there can be no net accumulation of electrical charge during an electrochemical reaction i.e. the polarization curve.
The equilibrium potential given in a typical galvanic series MIL-STD-889 is also referred to as mixed-potential of the particular material when it’s cathodic and anodic currents are equal in that specific environment. The same applies to galvanic corrosion between two different materials. When two different materials are electrically coupled in the same electrolyte, both materials are polarized to a new potential lying in between the two-uncoupled corrosion potentials which can be explained by mixed potential theory.
This can be illustrated by plotting the current produced as a function of applied potential, called a polarization curve. The magnitude of current flow and the increase in corrosion rate due to this coupling are determined by the tendency of each of the materials in the couples to deliver current when its potential is forced to change, called polarization. If a material delivers little current for a large change in potential, it is said to have a large polarization resistance, while if it can deliver a large current for a small enforced potential change, it is said to have a small polarization resistance. The latter is often the case with e.g. aerospace aluminum alloys when they are anodically polarized.
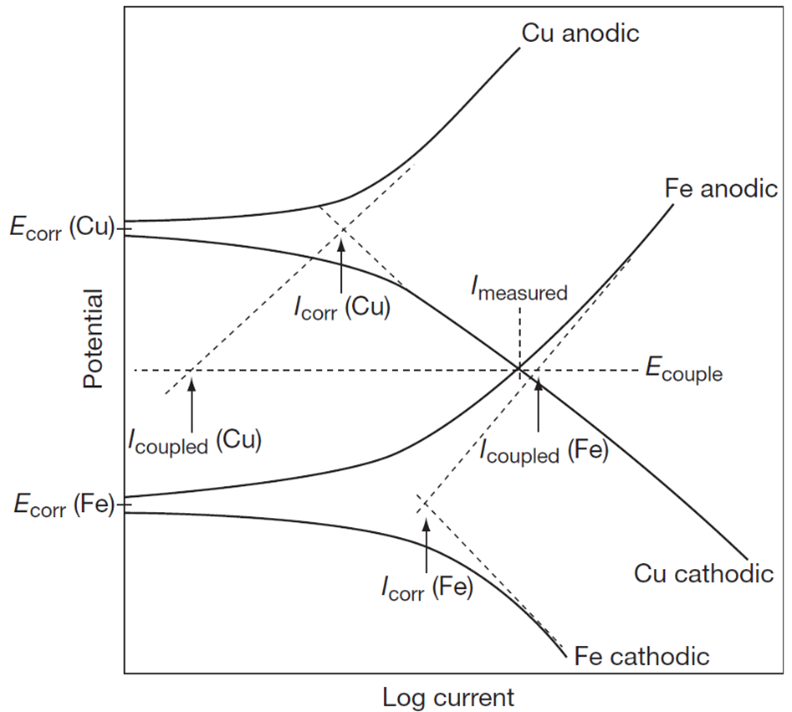
For galvanic corrosion, the curve-crossing or intersection of an anodic curve of a less noble metal of the couple with a cathodic curve of a more noble metal gives the galvanic current and potential of the couple for equal surface areas. This is depicted in Figure 3 showing anodic and cathodic polarization curves which are used to visualize the polarization within a galvanic couple. In this case the iron is the anode and copper is the cathode in the couple. The solid lines represent experimental polarization curves of copper and iron. The dashed lines represent the polarization curves for the half cell reactions defining the uncoupled corrosion potentials, \({E\text{corr}}\) for anode and cathode, respectively. The mixed potential or couple potential, \({E\text{couple}}\) is established where anode and cathode are polarized to potentials by the same galvanic current, \({I\text{couple}}\).
Reduction reactions on the anode metal are assumed to be very small compared to such reactions on the cathode, shown in Figure 3. That is, \({I\text{couple}}\) >> \({I\text{corr.A}}\). The galvanic current \({I\text{couple}}\) which essentially translates to the rate of galvanic attack on the anodic metal is a more accurate way to assess galvanic corrosion susceptibility of a bimetallic couple since it is a measure of corrosion kinetics. Corrosion Djinn calculates and reports the galvanic current, mixed potential values on the fly once the user has made the material selection for assessment.
Galvanic coupling current divided by the anode area gives the average anode current density which is proportional to average corrosion or penetration rate. One key assumption of this approach is that there is no ohmic resistance between anode and cathode. Such a condition may occur when e.g. two dissimilar materials are in direct/electrical contact immersed in a very conductive electrolyte e.g. seawater with very low ohmic drop in the electrolyte.
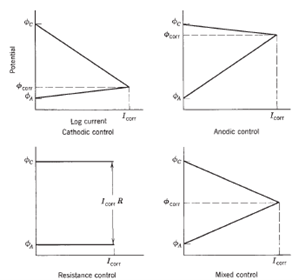
Additionally, a distinction is made between anodic polarization (displacement of the anodic potential in the positive direction) and cathodic polarization (displacement of the cathodic potential in the negative direction). The extent of the electrode activity can be judged by the amount of potential shift. The kinetics of the process can consequently be determined from the relationship between the shift in electrode potential and the current density. This dependence can be seen in Figure 4.
When polarization occurs mostly at the anodes, the corrosion reaction is said to be anodically controlled. Under anodic control, the corrosion potential is close to the thermodynamic potential of the cathode. When polarization occurs mostly at the cathode, the corrosion rate is said to be cathodically controlled. The corrosion potential is then near the thermodynamic anode potential. Resistance control occurs when the electrolyte resistance (due to low ionic concentrations) is so high that the resultant current is not sufficient to appreciably polarize anodes or cathodes. An example occurs with a porous insulating coating covering a metal surface. The corrosion current is then controlled by the IR drop through the electrolyte in pores of the coating. It is common for polarization to occur in some degree at both anodes and cathodes. This situation is described as mixed control. The extent of polarization depends not only on the nature of the metal and electrolyte, but also on the actual exposed area of the electrode.
In particular, the kinetics of cathodic control could be further categorized into three main regions in the polarization curves. Firstly, cathodic control due to charge transfer limitation which occurs at low current density near open circuit potential region and derives from the slowness (irreversibility) of the reactions taking place on the surface of the electrodes. The charge transfer reaction depends on the nature of the electrode materials, reactant activities, electrolyte, electrochemical mediators, electrode microstructure and operational conditions such as temperature, pressure, concentration and flow condition. Next, the cathodic reaction could be under mass transport limitation which results from the changes in concentration of the reactants (or products) at the interface between electrode surface region and bulk electrolyte; this limitation is prevalent at relatively high current densities if the reactants cannot be supplied to the electrode reaction zones at the rate required to sustain the generation of current. The presence of high concentrations of product species can also lead to the reduction of transport of reactants to where they are needed. Mass transfer derived overpotentials are affected by the geometry and the structure of electrodes, the nature of the electrolyte, and the products that are present. Finally, cathodic reaction under mixed diffusion meaning the cathodic current is influenced by both charge transfer kinetics and mass transport.
Common anodic materials are aluminum and magnesium alloys, and sacrificial coatings such as zinc and cadmium. Common cathodic materials include stainless steels, titanium, and the carbon in carbon fiber composites (CFCs). Placing an anodic material such as 2024 aluminum next to a cathodic material such as stainless steel (which is commonly done with bushings in air structures) in a humid, chloride salt (\(\text{NaCl}\)) containing environment results in rapid corrosion and pitting of the aluminum at a rate of about 55 \(µm\) (0.002”) per year.
MIL-STD-889C defines standard practice for classifying dissimilar metals and establishes requirements for protecting coupled dissimilar metals against corrosion. The standard is applicable to all military equipment parts, components and assemblies. Although the standard proposes the use of a galvanic series to assess material compatibility it does state that ‘compatibility does not indicate complete freedom from galvanic action’. The standard continues to warn that the degree of corrosion is influenced by kinetic factors such as polarization effects. The reader is referred to the Appendix B of the standard which states;
electrode polarization behavior is a means by which the compatibility of coupled dissimilar metals in solution can be established…
… The limiting current corresponds with the intersection of the polarization curves. This is a maximum current obtainable in the system if constant conditions are maintained.
Corrosion Djinn is a simulation software tool that reports the intersection point between polarization curves of different materials to determine the maximum corrosion current as MIL-STD-889C suggests. When the user enters two materials of a galvanic couple on the data entry page of Corrosion Djinn the software takes the polarization curve data of the two materials (including their coatings and surface treatments) from its internal electrochemical database and finds the intersection point, by overlaying the cathodic curve of the nobler material with the anodic curve of the more active material. This point defines the mixed potential and the corrosion current. From data entered for each curve in the database Djinn also calculates the galvanic corrosion rate reports the self-corrosion rate.
In order to help the user understand the impact of the material choices we have defined a metric that we call the Galvanic Acceleration Factor;
The galvanic acceleration factor (GAF), essentially measures the multiplying factor by which galvanic corrosion exceeds self-corrosion. All of this information, together with the polarization curves, is output to the user.
Djinn electrochemical database
The key for the Djinn software is the electrochemical database of qualified polarization curves for various materials in order to be able to predict galvanic corrosion between different materials, coatings, and treatments. Corrdesa together with NAVAIR, academic, and commercial organizations’ team of experts has developed a set of Best Practices for acquiring the necessary electrochemical polarization data to ensure that all of the data are consistent and of high quality. So, the polarization data stored in the Djinn electrochemical database has all been gathered using this standard 810 to ensure robust and consistent data.
Corrosion rate calculation
Along with this data, using standard methods 9 the equivalent weights of all the alloys is also stored, thereby allowing calculation of corrosion rate, which is reported in microns per year and mils per year. The equation used in essentially Faraday’s law adjusted for the particular units employed in this application, that is, corrosion rate in microns per year per \(1 A/m^2\);
Where the units are shown in Table 1.
| Parameter | Units |
|---|---|
| Corrosion Rate | Microns per Year |
| Equivalent Weight | Grams |
| Material Density | Grams per Cubic Centimeter |
Table 1 Units employed in annual corrosion rate calculation (per \(A/m^2\))
References
-
Standard Guide for Development and Use of Galvanic Series for Predicting Galvanic Corrosion Performance. G82-98 (Reapproved 2014) ↩
-
A. de Rooij, Bimetallic compatible couples, ESA Journal, Vol. 13 (1989), p 199-209. ↩
-
A. Groysman, Corrosion for everybody, Springer, 2010. ↩
-
M. Tullman, P.R. Roberge, in Uhlig’s corrosion handbook R.W. Revie (Ed.), John Wiley & Sons Inc., 2000, pp.309-310. ↩
-
Stansbury, E.E, Buchanan, R.A., “Fundamentals of Electrochemical Corrosion” July 2000, ASM International, The Materials Information Society. ISBN 0-87170-676-8. Chapter 4, Kinetics of Coupled Half-Cell Reactions. ↩
-
Carl Wagner, Wilhelm Traud, “Über die Deutung von Korrosionsvorgängen Durch Überlagerung von Elektrochemischen Teilvorgängen und Über die Potentialbildung an Mischelektroden,” [On the Interpretation of Corrosion Processes Through the Superposition of Electrochemical Partial Processes and on the Potential of Mixed Electrodes] Zeitschrift Für Elektrochemie und Angewandte Physikalische Chemie, vol. 44, no. 7, p. 391-402 (1938). For translation see F Mansfield, CORROSION—Vol. 62, No. 10, pp 843-855. ↩
-
Hack, H. P. Corrosion Testing Made Easy; NACE International: Houston, TX, 1993; Volume 2. ↩
-
Best Practices for Polarization Data Acquisition: Data Collection Guide for MIL-STD-889C Technical Revision. Prepared by Naval Air Systems Command. Version 4 FINAL. Victor Rodriguez-Santiago, Ph.D., Naval Air Systems Command – NAVAIR, Corrosion and Wear Branch - Code 4.3.4.6. Ph: 301-342-8040, Fax: 301-995-0742, victor.rodriguezsant@navy.mil ↩
-
Standard Practice for Calculation of Corrosion Rates and Related Information from Electrochemical Measurements. ASTM G102-89 (reapproved 2105) ↩
-
AMPP TM21510, Potentiodynamic Scans: Material Preparation, Data Acquisition and Analysis (www.ampp.org) ↩